MADE Homepage Video Overview
MADE Homepage Video Overview
MADE: Home Page
Welcome to the Medicare Analytics and Data Engine (MADE) home screen. This is the page users go to when navigating to MADE from the CRS Portal.
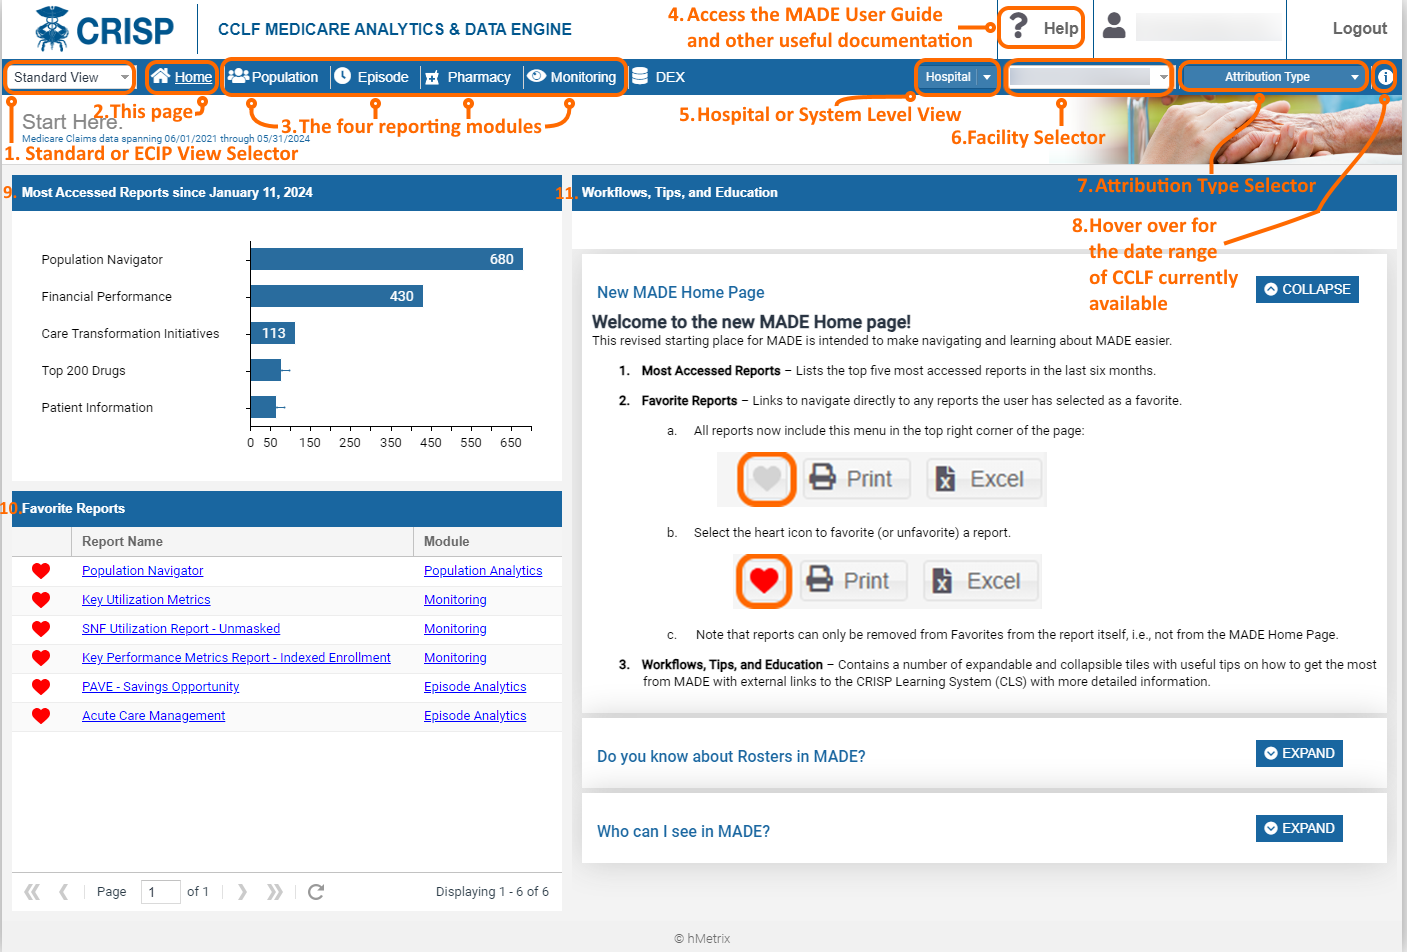
| 1. Standard or ECIP View Selector | Toggles between the Standard View and the ECIP View of MADE. Standard View includes all available touch and MPA-related beneficiary attribution options while Standard View includes only beneficiaries who have been discharged from the selected hospital with an APR DRG that could trigger an ECIP episode. To help differentiate the views, the header for Standard View is blue while the header for the ECIP View is orange. |
| 2. This Page (Home) | The screenshot shows the landing page that users see when navigating to MADE from the CRS Portal. It includes filters and menu options along the toolbar. |
| 3. The Four Reporting Modules | Click any of these to navigate directly to the corresponding module, which contains a collection of reports. The purpose and content of each module is presented in detail below. |
| 4. Help | Navigates to a collection of documents to aid users in their experience with MADE. This includes the MADE User Guide, as well as frequently asked questions, common workflows, and references on how to use Roster functionality in Population Navigator. |
| 5. Hospital or System Level View | Allows users with appropriate permissions to select either one hospital, or a complete hospital system in aggregate. By selecting “Hospital” from the drop down, users can then select one hospital from the Facility Selector (#6 below) for which the reports will be populated. By selecting “Hospital System” from the drop down, users can then select a complete hospital system for report generation from the Facility Selector. For users with access to a subset of hospitals within a system, the Hospital System drop down menu will present the complete hospital system name, but the beneficiaries loaded will reflect only those attributed to the permissible hospitals. |
| 6. Facility Selector | Drop down to select the individual hospital or hospital system for which the reports will be populated. Note that users with access to only one hospital / hospital system will not need to make a selection, as the permissible hospital / system will be selected by default. |
| 7. Attribution Type Selector | Presents options for which beneficiary attribution types to include in the reports. The default selection presents all beneficiaries with an inpatient admission or emergency department “touch” (visit) at the selected hospital any time within the most recent 36 months of CCLF data. |
| 8. CCLF Information | Hover over this icon to view the current date range of CCLF claims data available in the reports. The reports will always contain the most recent 36 months of claims. Beneficiaries do not need to meet attribution requirements in the current month to be included in the reports. That is, a beneficiary with one inpatient or emergency room touch at the selected hospital will remain available in MADE until the touch is no longer in the 36-month date range. |
| 9. Most Accessed Reports | This lists the most accessed reports over the last six months by all MADE users. |
| 10. Favorite Reports | List of reports that have been favorited by the current user. Navigate directly to a favorited report by clicking on the report title. |
| 11. Workflows, Tips, and Education | A collection of expandable and collapsible tiles that will often contain links to CRISP Learning System (CLS) content that goes into detail about a particular aspect or workflow in MADE. |
MADE Reporting Modules:
Population
The Population module includes the Population Navigator and Population Analytics reports.
Population Navigator contains the list of beneficiaries used to populate all MADE reports. See Attribution Type for a description of the beneficiary attribution types. The Population Navigator also includes Patient Summary, which presents all demographic and clinical characteristics about the beneficiaries, as well as a series of patient-specific reports according to their CCLF diagnostic and utilization characteristics. Patient Timeline within Patient Summary graphically presents patient-specific healthcare utilization over time including receipt of services across all settings and prescription drug use.
Population Analytics provide reports that aggregate the overall attributed population based on a variety of variables.
The Population module reports contain all health care utilization and payments for Part A and B Medicare services. Part D prescription drugs details are only included in the Patient Navigator reports.
Episode
The Episode module presents reports based on episodes of care. These episodes of care are developed in accordance with Maryland’s Episode Care Improvement Program (ECIP) Care Redesign Program and only includes beneficiary discharges from the selected hospital in MADE. Episodes are clustered into APR DRG “families” based on clinical episode categories developed in CMS’ Center for Medicare and Medicaid Innovation (CMMI) initial Bundled Payment for Care Improvement (BPCI) and BPCI Advanced initiatives.
Not all hospital discharges are available in the episode module, as clinical conditions not associated with either BPCI or BPCI Advanced are not included in MADE.
The Episode module is available in both Standard View and ECIP View of MADE. However, in Standard View, inpatient payments are included in the episode payment calculations, while in ECIP View, ECIP policy-specific exclusions are implemented so that inpatient payments are not included in the episode payment calculations.
Pharmacy
The Pharmacy module contains reports on prescription drug utilization by volume, payment, high-risk medications, and top therapeutic category, among others. This module contains both detailed reports that allow for drill-through down to patient-level claims data, as well as summary-level reports. Pharmacy Analytics includes pharmacy utilization for Part B and D prescription drugs.
Across this module, Part D pharmacy payments are estimated using the published average wholesale price (AWP) for the respective medication, and Part B pharmacy payments are taken directly from the Medicare payment within the claims data. Note that not all Medicare beneficiaries in MADE have Part D coverage; therefore, this module is not reflective of the complete attributed population available in other modules.
Monitoring
The Monitoring Report module contains reports to enable hospital users to track performance across time and programs/providers. Specifically reports are designed to track overall utilization and spending trends across patient rosters and to evaluate risk-adjusted utilization metrics for beneficiaries under the care of their hospital who are admitted to skilled nursing facilities.

