Snapshot
A Summarized View of Key Patient Data
A Summarized View of Key Patient Data
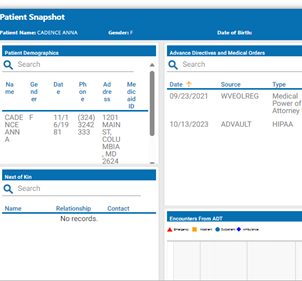
The Snapshot application was built to give end users a summary view of key patient data without having to filter or click through pages of data. Snapshot is available through the CRISP Portal. Users can see recent encounters, medications, and procedures, among many other widgets that provide critical information on their patient. These widgets display an aggregation of both clinical and non-clinical data for the selected patient and pulls this information from internal and external sources to provide an at-a-glance view of the patient’s clinical history.
Physician – “Before I meet with my patient during a visit, I can use the Snapshot feature to identify potential issues that I need to be aware of and discuss with my patient. I can quickly see their care team, and any healthcare encounters they had in the past year. This provides me with a quick orientation before digging into my patient’s details in preparation for our appointment.”
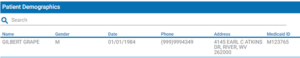
Patient demographic information includes the patient’s name, gender, date of birth (DOB), phone number, address, and (when available and applicable) Medicaid ID based on the most recent patient record provided to CRISP.
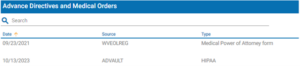
Any advance directives or medical orders this patient has on file will display here. Advance Directives available through CRISP are provided by mydirectives.com, a third-party website (separate from CRISP) that partners with patients to store their directives electronically. Users can click an entry in this table to launch and view a pdf copy of the directive or medical order.
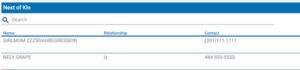
Provides a list of closest living relatives to the patient on file from different sources. The Next of Kin widget will display their contact information if available. CRISP does not edit or filter these results but rather passes all next of kin information provided by CRISP participants regardless of data accurately or completeness.
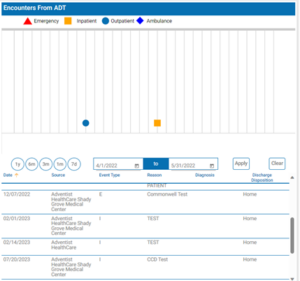
This widget displays patient’s emergency, inpatient, outpatient, and/or ambulance encounters as a histogram by encounter type across a flexible date range. Each encounter type will display on the histogram graph as a different color and shape symbol (icon key is above the graph). Users can use the date filters to change the date range displayed in the graph. Be sure to click apply once the dates in the date boxes are selected. The preset filter buttons (left side 1 year, 6 months, 3 months, 1 month, and seven days circles) apply only to the dates selected in the filter, not the current date. For example, if the date range selected is 4/1/2022 to 5/31/2022 and the user clicks the 1-month button – the graph will display the last month from the last date (5/31/2022) not from the current date. Users can hover over the symbol in the histogram to view the date, source, event type, reason, diagnosis, and discharge disposition for the encounter. This information for every encounter this patient had from the past three years is displayed in the table below the graph.
Like the Encounters from ADTs widget, the Encounters from claims widget displays patient’s encounters as a histogram by encounter type across a flexible date range. The difference is the encounter data now is derived from insurance claim information. CRISP’s claim data arrives from MD Hospital All Payer, MD-DC-WV Medicaid, and MD Medicare (also displayed as CCLF) claims. Each encounter type will display on the histogram graph as a different color and shape symbol (icon key is above the graph). Users can use the date filters to change the date range displayed in the graph. Be sure to click apply once the dates in the date boxes are selected. The preset filter buttons (left side 1 year, 6 months, 3 months, 1 month, and seven days circles) apply only to the dates selected in the filter, not the current date. For example, if the date range selected is 4/1/2022 to 5/31/2022 and the user clicks the 1-month button – the graph will display the last month from the last date (5/31/2022) not from the current date. Users can hover over the symbol in the histogram to view the date, provider, payer, claim type, and reason for the encounter. This information for every encounter this patient had from the past three years is displayed in the table below the graph.
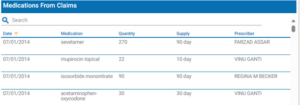
This widget displays the patient’s medication history from MD Hospital All Payer, MD-DC-WV Medicaid, and MD Medicare (also displayed as CCLF) claims. The table here includes the prescribed date, medication name, quantity in units, supply of the prescription, and prescriber’s name.
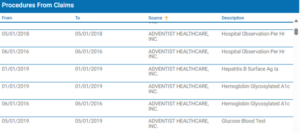
This widget displays the patient’s procedures history from MD Hospital All Payer, MD-DC-WV Medicaid, and MD Medicare (also displayed as CCLF) claims. Procedures differ from Encounters as procedures are the billable events that may take place during an encounter. For example, the whole inpatient hospital stay would be an encounter which may include multiple procedures like electrocardiograms, medicine injections, blood panels etc. The table here includes the date range, source (location preformed), and description of the procedure.
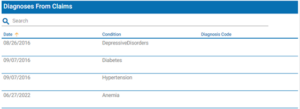
This widget displays the patient’s diagnoses history from MD Hospital All Payer, MD-DC-WV Medicaid, and MD Medicare (also displayed as CCLF) claims. Diagnoses are conditions or disease states which identify the cause of the patient’s symptoms to inform management and prognosis. Examples of diagnoses include Diabetes, Heart Failure, Anemia, Cancer, etc. The table here includes the date, condition, and diagnosis code.
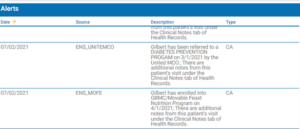
The alerts widget contains information on patient referral, health base program enrollment/completion, clinical alerts of overdose events, and infectious disease testing and results. The table here includes the date, source code, description, and type of alert.
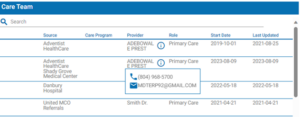
The Care Team widget lists the organizations and providers that have a relationship with your patient. This can include your patient’s care program and care manager and identifies the ‘start date’ and ‘last updated’ dates for a Care Team relationship. Care Team data is populated from ADTs and patient panels submitted to CRISP. Hover over the blue information icon (if available) to get contact information for providers and care managers. When the Care Team is identified as a 42 CFR Part 2 (substance use disorder treatment) facility, an orange icon symbol will appear at the beginning of the Care Team row. Clicking on the icon will show a disclaimer specifying that the information contained is subject to 42 CFR Part 2 rules. The table here includes the source of the information, associated care program, provider name, role, and date range of relationship.
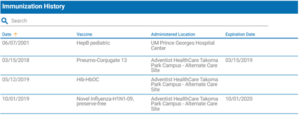
The immunizations (Vaccine) history widget displays all the patient’s immunizations reported to CRISP through the relevant state’s Immunization Information System (IIS). Maryland’s IIS is Immunet. The table here displays the vaccine date, vaccine name, administering location, and expiration date of the immunization.
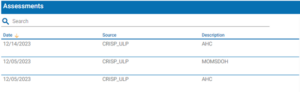
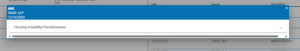
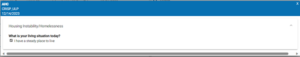
Any social determinants of health screening information shared with CRISP will display in this table. Social screening questionnaires and topics include Housing instability, food, living, transportation, utilities, safety, financial situation, employment, education, substance use, mental health, etc. Users can click on a record to load the entry and view the screening response.
Subscribe

