Potentially Avoidable Utilization (PAU)

Reports built for users to understand hospital performance under the HSCRC’s Potentially Avoidable Utilization (PAU) Program

Overview

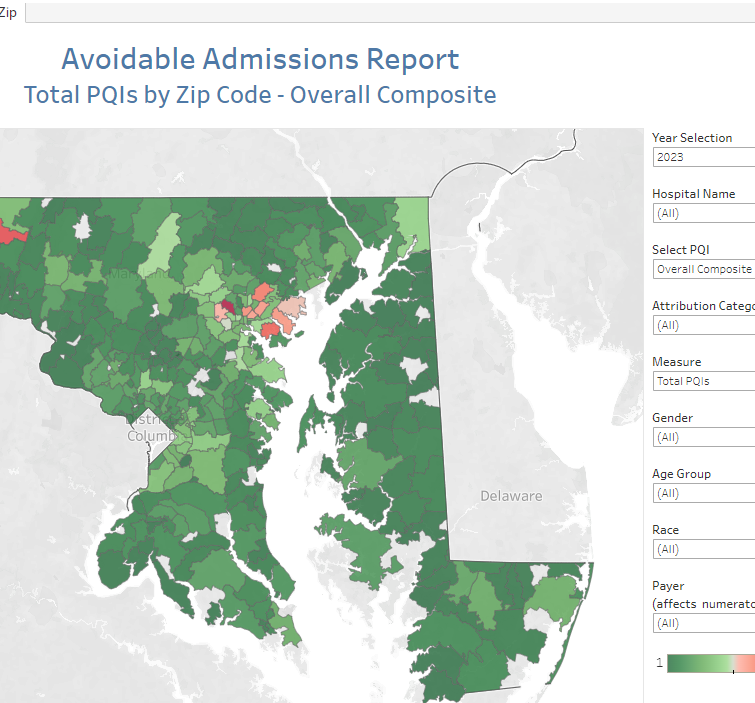
The PAU policy prospectively reduces Global Budget Revenues (GBRs) in anticipation of reductions in avoidable utilization. Potentially avoidable utilization is measured within the PAU policy through Sending Readmissions, Prevention Quality Indications (PQIs), and Pediatric Quality Indicators (PDIs). PQIs and PDIs are admissions for ambulatory care sensitive admissions that may be preventable with effective primary care and population health. In prior years, PQIs were attributed to the hospital where the visit occurred. The logic was changed in 2019 and PQIs and PDIs were assigned to hospitals based on the MPA attribution for their Medicare population and on a geographic attribution for non-Medicare patients. Since 2021, the attribution logic was changed to assign PQIs and PDIs on a geographic attribution only. Under this approach beneficiaries and their costs are assigned to hospitals based on their residency. The following section describes how the PQIs are identified and assigned to hospitals.

The Health Services Cost Review Commission (HSCRC) writes the Potentially Avoidable Utilization (PAU) Savings policy and methodology behind these reports, which CRISP hosts on the CRS portal on the HSCRC’s behalf. More information on the policy and methodology can be found on the HSCRC Website.

The CRISP Reporting Services Portal hosts a few types of reports built for users to understand hospital performance under the HSCRC’s Potentially Avoidable Utilization (PAU) Program.

Below is a brief description of each type:

  1. PAU Savings Performance – The PAU Savings Report is the final monthly product of the PAU reporting process. This report summarizes the primary measures of the PAU policy (sending readmissions, PQIs, and PDIs), and annualizes them for projection purposes. Please refer to the report’s second tab (Data Dictionary) for information regarding the distinct fields in the report.
  2. PAU Summary Reference – The PAU Summary Report is provided monthly as a hospital level aggregate of year-to-date performance in the key PAU measures. Included in the report are measures of non-PQI readmissions, PQIs, PDIs, and cost and revenue information. Row 5 details any intra-excel calculations that occur within the sheet. The PAU Summary Report intends to summarize the information found in the PAU Details Reports, and as such includes hospital level admissions and readmissions before attribution is applied. Therefore, these numbers may ultimately differ from downstream products like the PAU Savings Report, which is produced after attribution methodology is applied.
  3. PAU Details – The PAU Details Reports are provided to each hospital for encounter level analyses of flagged PQIs and Readmissions. These monthly reports should be understood as one row per encounter and includes both Inpatient and Observation encounters. One detail report enumerates encounters from the beginning of the calendar year through the available data unless otherwise specified. Details include encounter dates, cost information, clinical flags, and binary flags for PQIs, PDIs, and non-PQI readmissions. It is important to note that PAU Detail files enumerate PQIs and PDIs that occur at the file-subject hospital, but through attribution these PQIs/PDIs may be attributed to another hospital in the final PAU adjustments. These reports should be downloaded by hospitals for additional encounter level analyses.
  4. Avoidable Admissions Report – The Avoidable Admissions Report provides a comprehensive package that enables viewers to see per capita prevention quality indicator (PQI) and pediatric quality indicator (PDI) values. In the Avoidable Admission Report, PQIs and PDIs are assigned to hospitals based on the MPA attribution.

Subscribe

Stay up to date on everything. Sign up for our newsletters.