Public Health Dashboard

Overview

The Public Health Dashboard is designed for individuals working on population health and public health, who want a deeper understanding of the community’s health. With this dashboard, users have the ability to analyze Maryland hospital utilization and filter on metrics of interest such as demographics, conditions, geography, payer type, utilization type, and much more. Throughout the dashboard, users can define a population of interest that will persist through the report to better understand that population’s characteristics. Users can compare this population to statewide metrics or another user defined population. The dashboard hosts two interactive maps of Maryland to drill down into utilization by county or zip code and view areas of excess. Please note that any comparisons in this report are not case mix adjusted but are direct comparisons. Trending and hospital claim service line analysis are also accessible.

Data Sources

The primary data source shown in this report is the HSCRC Case Mix data. The Case Mix data includes all visits at Maryland hospitals across all payers. This report has been filtered to only show Maryland residents who visited Maryland hospitals. This report does not include Maryland residents who visited out of state hospitals.

Please note: This is a summary level report, all visit or patient counts of 10 or less will be suppressed.

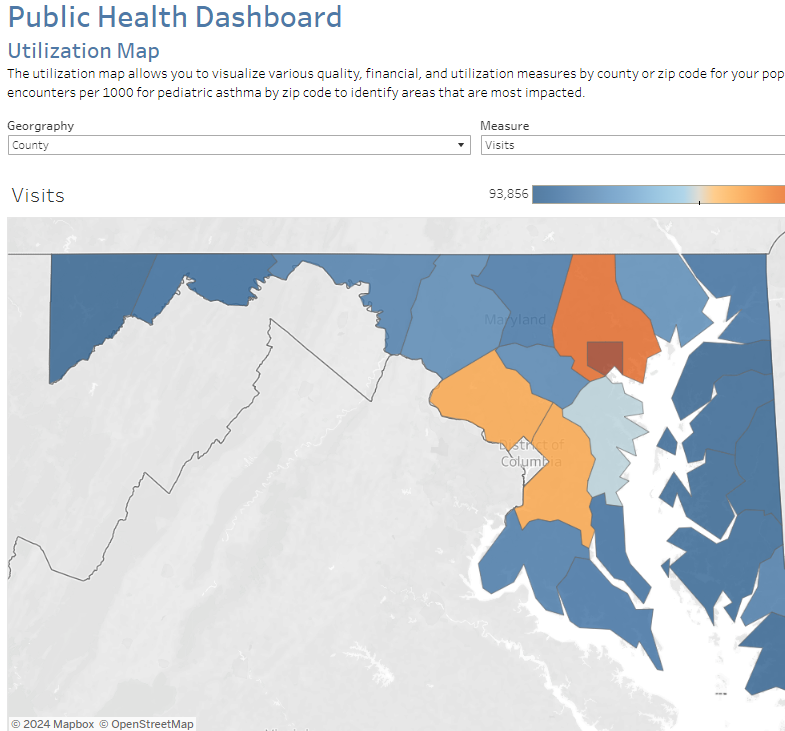
For all utilization and cost measures, the county and zip code values come from the Case Mix data. The county/zip code shown reflects the county and zip code where the patient resided at the time of their visit.
For all population counts and rate denominators, the county and zip code values come from the American Community Survey 5-year estimates.
When applying filters, population denominators do not change based on age, race, and gender. The rate will remain out of the total population.

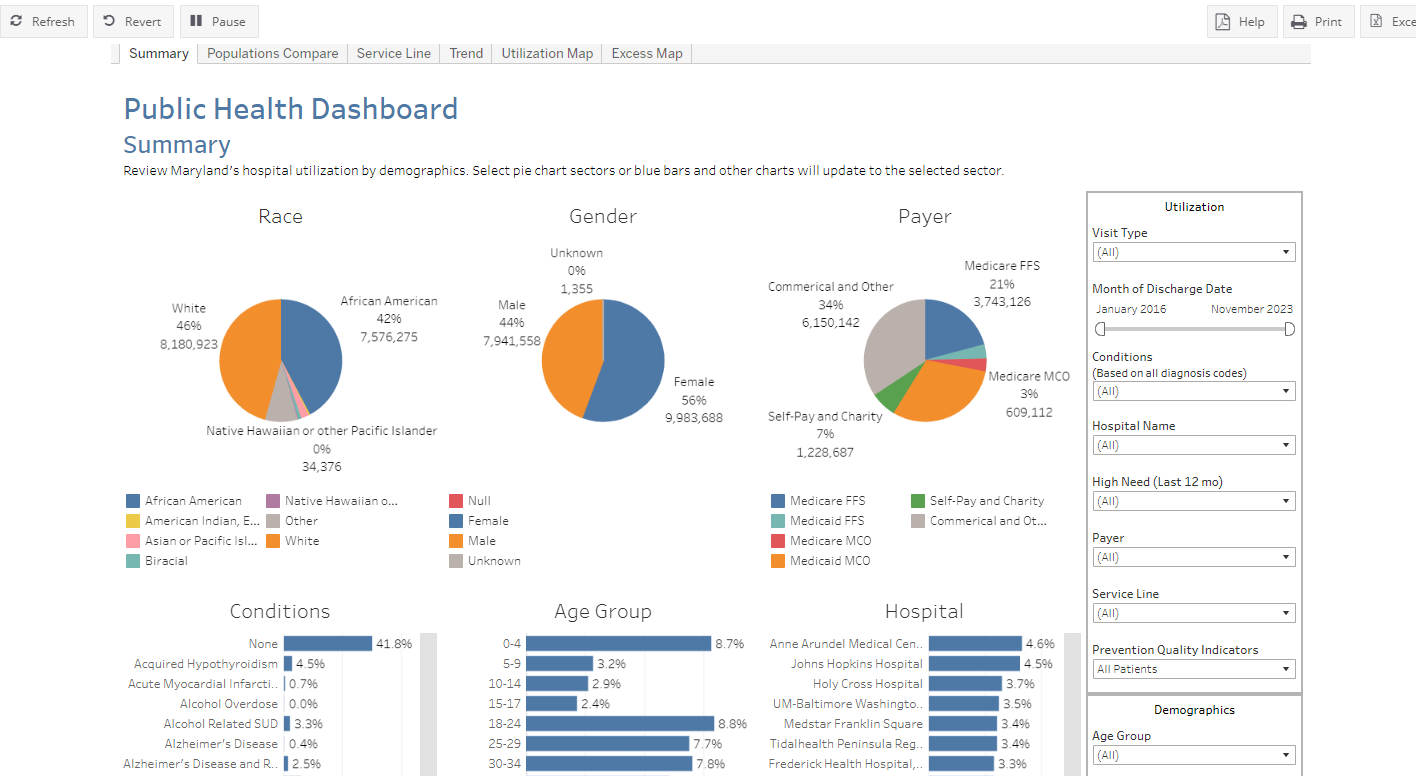
“The Prevention Quality Indicators (PQIs) are a set of measures that can be used with hospital inpatient discharge data to identify “ambulatory care sensitive conditions” (ACSCs) in adult populations. ACSCs are conditions for which good outpatient care can potentially prevent the need for hospitalization, or for which early intervention can prevent complications or more severe disease.
Even though these indicators are based on hospital inpatient data, they provide insight into the quality of the health care system outside the hospital setting. Patients with diabetes may be hospitalized for diabetic complications if their conditions are not adequately monitored or if they do not receive the patient education needed for appropriate self-management.

The PQIs assess the quality of the health care system, and especially the quality of ambulatory care, in preventing medical complications. As a result, these measures are likely to be of the greatest value when calculated at the population level and when used by public health groups, state data organizations, and other organizations concerned with the health of populations.”

For more information on how each PQI is calculated, please visit the AHRQ Website.

Also, you can visit the AHRQ website for more information on PQIs on this AHRQ Webpage.


The Public Health Dashboard uses the HSCRC’s Readmission Reduction Incentive Program (RRIP) definition of a readmission. The RRIP defines a readmission as all-payer, 30-day, all-cause inpatient readmissions at acute care hospitals, using the CRISP unique patient identifier to track patients across hospitals. The readmission measure excludes certain types of discharges from consideration, e.g., newborns and planned admissions. For more information on the RRIP Policy and readmissions, please visit the following HSCRC website page.

Service line is based on the 3M APR DRG grouper for inpatient admissions and observation stays over 24 hours and the EAPG grouper for observation and ED visits. For best interpretation, we recommend that you separately filter on ED and observations under 24 hours from inpatient visits and observations over 24 hours. The service line can be interpreted as the primary service that a patient received in the hospital.

All conditions in this report are defined at the time of the patient visit and include all visits where the condition-specific diagnosis codes were present. For example, if you filter on asthma, the report will show the number of visits where an asthma diagnosis code was present.

Conditions not mentioned in the table below are defined through the CMS Chronic Condition Warehouse (CCW). CCW condition variables are developed from specific diagnosis codes, MS-DRG codes, or procedure codes. For more information, visit the CCW website.

Behavioral health conditions in the Public Health Dashboard were defined by the Clinical Classification Software (CCS-R) or Clinical Classification Software (Refined). CCS-R was developed by AHRQ as a tool for clustering patient diagnoses and procedures into a manageable number of clinically meaningful categories. For more information on CCS-R and CCS-R categories, please visit this AHRQ Webpage.

Condition Table


Condition

Definition

ICD Codes

Alcohol OverdoseAlcohol in combination with any other substanceICD-9: E860, E8600, E8601, E8602, E8603, E8604, E8608, E8609

ICD-10: T510, T510X1%, T510X4%, T511, T511X1%, T511X4%, T512, T512X1%, T512X4%, T513, T513X1%, T513X4%, T518, T518X1%, T518X4%, T519, T5191%, T5194%, T520, T520X1%, T520X4%, T521X, T521X1%, T521X4%

Any Mental Health ConditionMental health condition defined by Clinical Classification Software Refined in Categories from MBD001- MBD034Please refer to the CCSR link above for a list of the ICD-10 codes for this condition.
Any OverdoseAny diagnostic code related to an overdoseAll ICD codes in Opioid Overdose and Alcohol Overdose conditions.
Any Substance Use DisorderSubstance use disorders defined by Drug Use Disorder or Alcohol Use DisorderPlease refer to the CCSR link above to get the list of the diagnosis and procedure codes.
FallsFalls defined in ICD-10 codesICD-10: W00-W19, X80, Y01, Y30
MalnutritionICD code with any malnutrition diagnosis on visitICD-9: 262, 263.0, 263.1, 263.8, 263.9

ICD-10: E43, E44.0, E44.1, E46

Non – Alcohol Related SUDNon-Alcohol related SUD defined by Clinical Classification Software in Category 661Please refer to the CCS-R link above for a list of the ICD-9 and ICD-10 codes for this condition due to the large number of ICD codes.
Opioid OverdoseOpioid overdose as defined by the National Center of Health Statistics.Please refer to https://www.cdc.gov/nchs/dhcs/drug- use/icd10-codes.htm to get the list of ICD10 codes. Codes for intentional overdoes and assault have been excluded (ICD10 codes with X2 and X3)
Suicide and intentional self-harmSuicide and intentional self-harm defined by Clinical Classification Software in Category 662Please refer to the CCS-R link above for a list of the ICD-9 and ICD-10 codes for this condition due to the large number of ICD codes.
Firearm Related InjuriesICD codes with any firearm injury code on visitICD-10: W321, W330, W331, W340, W341, X72, X73, X74, X93, X94, X95, Y22, Y23, Y24, Y350, Y384

Measures


MetricDefinition
VisitsCount of Inpatient, Observation, and/or ED visits that occurred. This measure is based on Case Mix data
PatientsCount of unique patients. This is based on Case Mix data
Visits per 1000Visits per 1000 residents in selected geography (statewide, county, or zip). The numerator in this measure is based on Case Mix data. The denominator is based on the American Community Survey 5-year estimate.
Patients per 1000Patients per 1000 residents selected geography (statewide, county, or zip). The numerator in this measure is based on Case Mix data. The denominator is based on the American Community Survey 5-year estimate.
Readmit RateRate of readmission based on the HSCRC RRIP. The numerator is the number of RRIP readmissions based on the Case Mix data. The denominator is eligible discharges from inpatient hospital stays.
PQI RateRate of PQI occurrence. The numerator is the number of visits considered a PQI based on Case Mix data. The denominator is eligible bedded care visits.
LOSTotal length of stay for all visits. Length of stay is set to one day for same day discharges. This measure is based on the Case Mix data.
LOS per VisitAverage length of stay per visit. This measure is based on the Case Mix data.
ChargesTotal charges for visits. This measure is based on the Case Mix data.
Charges per CapitaCharges per residents in zip code, county or statewide. The numerator is based on the Case Mix data. The denominator is based on the American Community Survey 5-year estimates for the selected geography (statewide, county, or zip).
Charges per PatientAverage charges per patient. This measure is based on Case Mix data.
Charges per VisitAverage charges per visit. This measure is based on Case Mix data.


Webinar

Subscribe

Stay up to date on everything. Sign up for our newsletters.