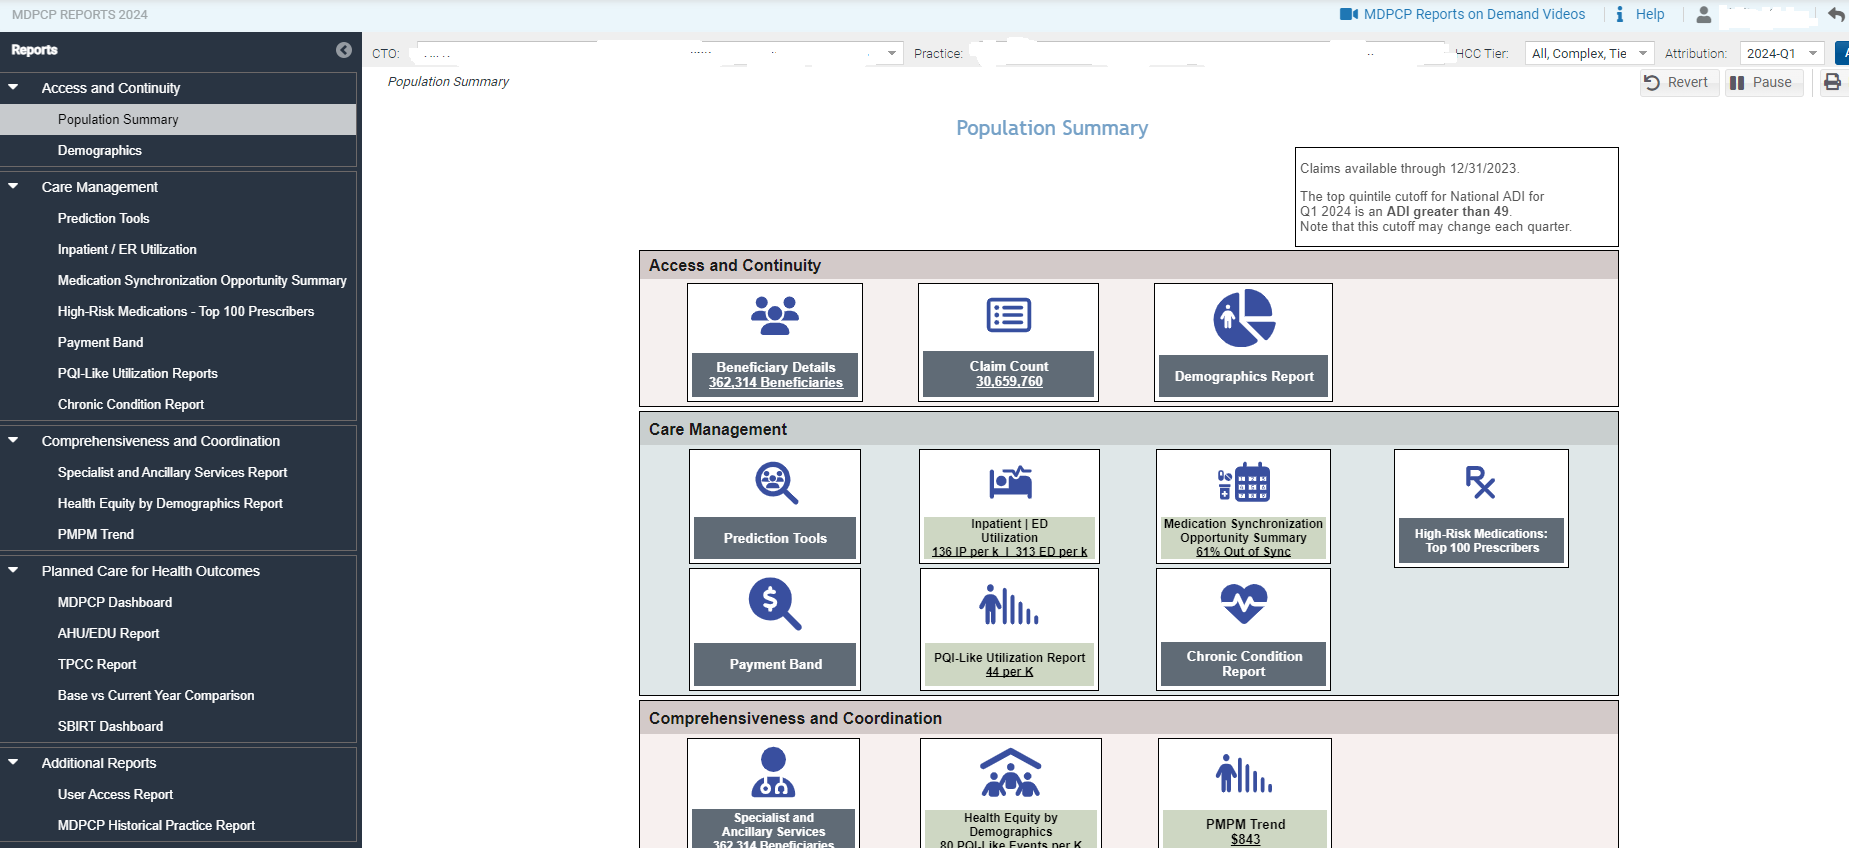
Population Summary serves as an initial dashboard with direct links to all reports and presents metrics of interest. Click the text box in any of the cards to navigate directly to the selected report including the patient level and claim level details.
Report icons that contain metrics are color coded to indicate performance relative to the overall MDPCP. Colors range from green to red, with green indicating favorable performance relative to the overall MCPCP. A darker color represents further distance from the overall program’s value. Please note that with the exceptions of Medication Synchronization Opportunity Summary and AHU/EDU, the icons with color coding, the figures represent the 33-month period described at the top of the page.
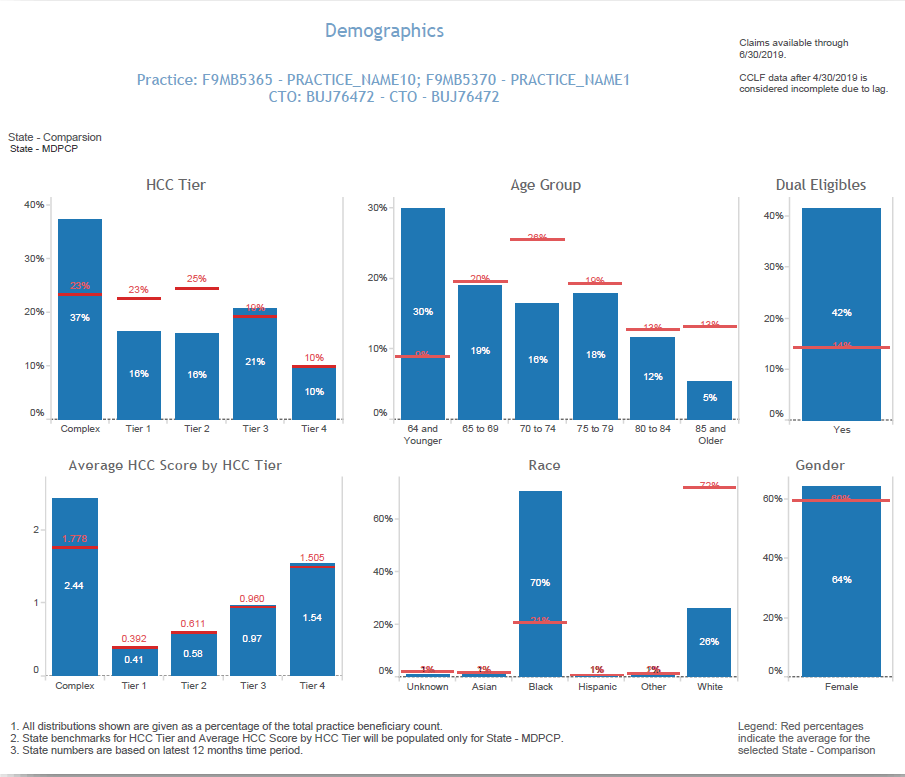
Demographic Report – shows the distribution of attributed beneficiaries by HCC tier, age group, average HCC by HCC tier, race/ethnicity as well as gender and dual eligibility. Additionally, state levels for each distribution are presented in red, and there is a filter to compare to statewide MDPCP beneficiaries or to statewide beneficiaries regardless of MDPCP participation.
The Demographics report is based on attribution files that are updated quarterly and not each month as the CCLF data are. Beneficiary attribution to practices is revised annually. However, each quarter beneficiaries not attributed elsewhere may be added, and deceased beneficiaries are removed from the attribution file.
- Prediction Tools (View our FAQs)
- Pre-AH: The Avoidable Hospital Events (Pre-AH) Model™ score reflects a probability that a beneficiary will experience an avoidable hospital event (inpatient or emergency room stay) within the next 30 days. The events included in the Pre-AH ModelTM are PQI-Like Events; see section 2.2.6 for more information on PQI-Like Events.
- Pre-DC: The Hilltop Severe Diabetes Complications (Pre-DC) Model™ score reflects a probability that a beneficiary will experience an inpatient hospitalization or ED visit due to severe complications of type-2 diabetes in the next month across six domains of complications: ophthalmic/retinopathy; nephropathy; cerebrovascular; cardiovascular; peripheral vascular; metabolic. Please note that the Pre-DC prediction tool provides risk scores and reasons for risk for all attributed beneficiaries regardless of having been diagnosed as having Diabetes. Specifically, this tool indicates the risk of inpatient hospitalization or ED visit due to ophthalmic/retinopathic, nephropathic, cerebrovascular, cardiovascular, peripheral vascular, or metabolic complications. While these are typically complications of Type 2 diabetes, they can also have other causes.
- Pre-HE: The Hilltop Hospice Eligibility and Advanced Care Planning (Pre-HE) Model™ score predicts risk of eligibility for hospice. It is designed to support proactive advanced care planning discussions by estimating a patient’s probability of death within the next six months.
- Inpatient / ER Utilization Report – presents annualized inpatient admissions, 30-day readmissions, and ER visits per 1,000 beneficiaries. It also presents trend graphs by month. Below each trend graph is a histogram showing the count and percent of beneficiaries with IP admissions, readmissions, and ER visits by the number of events by month during the time period.
- Medication Synchronization Opportunity Summary – ranks the pharmacies by number and proportion of patients whose prescriptions are not synchronized. Medication synchronization refers to the extent to which a patient fills their prescriptions on a single day from a single pharmacy. Patients who fill prescriptions on multiple days in a single month and/or fill prescriptions at multiple pharmacies are considered not synchronized. Select a pharmacy to populate the chart at the bottom of the report. Select the Number of Out of Sync Patients to access the drill through to Beneficiary Details. Selecting any of the other three columns will allow for access to beneficiary details for all those who fill scripts at the highlighted pharmacy.
- High Risk Medications – Top 100 Prescribers – identifies the top 100 prescribers – not limited to MDPCP participating physicians – who prescribed medications identified as potentially high risk according to Beers criteria for potentially inappropriate medication use in older adults (> 65 years of age or older). The report displays the number of high risk medication claims by prescriber and the change from the previous 12 months. Click on Prescriber Name or Prescriber NPI to view detailed reports.
- Payment Band – presents the distribution of the total paid claims amount graphically and in tabular form. In the Total Payments by Payment Band bubble chart, the size of the bubble reflects the summed total of claims paid for beneficiaries with total claim payments within that band. The Beneficiary Distribution by Payment Band histogram shows the percentage of beneficiaries within each band along with the selected state comparison. The Beneficiary payment Band Details table includes the data presented in the charts above and additional detail. Clicking and then hovering over any payment band in either chart or the table allows the user to drill through to Beneficiary Details for those beneficiaries. The Payment Band report links to drilldowns to Beneficiary Details.
- PQI-Like Utilization Report – presents utilization for the selected practice(s) for IP admissions or ED visits1 that fall into one of eleven Prevention Quality Indicator (PQI) categories, using the 2022 AHRQ specifications. Whereas PQIs are described as rates, this report presents IP admissions and ED visits that would be included in the numerator of the rate calculation.
- Chronic Condition Report – assigns beneficiaries to Chronic Condition Warehouse (CCW) Chronic Conditions and Other Chronic or Potentially Disabling Conditions according to the presence of diagnosis and procedure codes on beneficiary claims. Unlike the prior CCS Condition Report, the CCW Chronic Condition Report identifies beneficiaries (not claims) based on their chronic condition flags. Since it is a beneficiary-level flag, the payment amounts reflect all Part A and B claims for the beneficiaries with these conditions. Beneficiaries can be included in multiple categories and the payment totals are not exclusive; the total payments for beneficiaries in multiple conditions are included in the totals for each category.
- Specialist and Ancillary Services – The Specialist and Ancillary Services Report (formerly called the Professional Services (BETOS/Place of Service) Report) presents beneficiary counts, claim counts and claim payment amount by type of procedure code. Services are clustered into types of service using the Restructured BETOS Classification System (RBCS) taxonomy, an enhancement from the Berenson Eggers Type of Service (BETOS) taxonomy. Professional services in this report are Part B covered services regardless of site of service that may occur in a physician’s office, SNF, hospital, or other settings. RBCS groups Health Care Financing Administration Common Procedure Coding System (HCPCS) codes into 8 procedure types. This report is limited to the key categories of interest. The goal of this report is to help users identify services frequently provided to beneficiaries by provider specialty, place of service, and specific provider.
- Health Equity by Demographics – This report allows users to view select one of eleven measures to view utilization over time. Additionally, users may also restrict the population according to five demographic filters, on Medicare/Medicaid Dual Eligibility status, and Medicare Status (Aged or Disabled).
- PMPM Trend – The Per Member Per Month (PMPM) Trend Report presents PMPM claim payment amounts by claim type (ER, hospice, outpatient, short term hospital, home health agency, physician, SNF, and other) and an overall summary by Part A and Part B claims. This report also shows quarterly trends in PMPM amounts by claim type for the practice and selected state reference. The PMPM Trend graphs and table and Top Providers by Payment Amount will by default show all claim types and may be filtered to a specific claim type by clicking on the respective bar in the PMPM by Claim Type chart.
- AHU EDU – The AHE/EDU report uses data provided directly by CMS. CRISP does not run the algorithms to calculate the observed or expected values, or the benchmark values displayed in this report. Data are provided by CMS on a quarterly basis, including a lag period of one quarter. Due to the alignment with the HEDIS-like AHU/EDU measure, observed counts will not align with counts reported elsewhere in the MDPCP Reports.
This report is intended to provide directional results on a practice(s) AHU/EDU utilization relative to their expected utilization, according to CMMI’s HEDIS-like measure. Final results calculated by CMMI and used for payment purposes may differ significantly from those presented in this report. - TPCC – The TPCC (Total Per Capita Cost) measure will be used to evaluate practice performance for PBIP. Like the AHU/EDU report, the TPCC report uses data provided directly by CMS. CRISP does not run the algorithms to calculate the observed or expected values. Data are provided by CMS on a quarterly basis, including a lag period of one quarter. Due to the risk adjustment component of the TPCC calculation, observed amounts will not align with amounts reported elsewhere in the MDPCP Reports.
This report is intended to provide directional results on a practice(s)’s TPCC relative to their expected utilization, according to the TPCC algorithm. Final results calculated by CMMI and used for payment purposes may differ significantly from those presented in this report. - Base vs Current Year – The Base Comparison Report shows various measures for the current calendar year (Year to Date) or rolling 12 months as well as the same figures for the respective previous year period. The “Base vs Current Year Comparison” report includes a filter for time period with options for YTD (Year to Date) or the rolling 12 months and presents metrics for the selected time period alongside figures from the respective historic months. The difference from base to current year is presented in percentage change.
- MDPCP Dashboard – The MDPCP Dashboard allows CTO users to view and compare high level metrics across multiple practices. The
filters can be used to specify the metrics, time period, population, and other categories of interest. Please note that non-CTO users will not see this report in the menu. Please also note that category selections do not apply to the State Comparison populations.

